
Is utility-scale solar going to become the dominant energy source in the world?
Part 1

Prior to seeing the Lazard levelized cost of energy (LCOE) analysis, I assumed that solar did not compete on a cost basis with other forms of power generation (specifically coal and natural gas), especially without production or investment tax credits. But Lazard claims that not only has solar had the greatest price drop over the past 15 years, a capital investment now competes, in some instances, with the marginal cost of generating power from other sources like combined gas cycle and coal, even without any tax incentive:
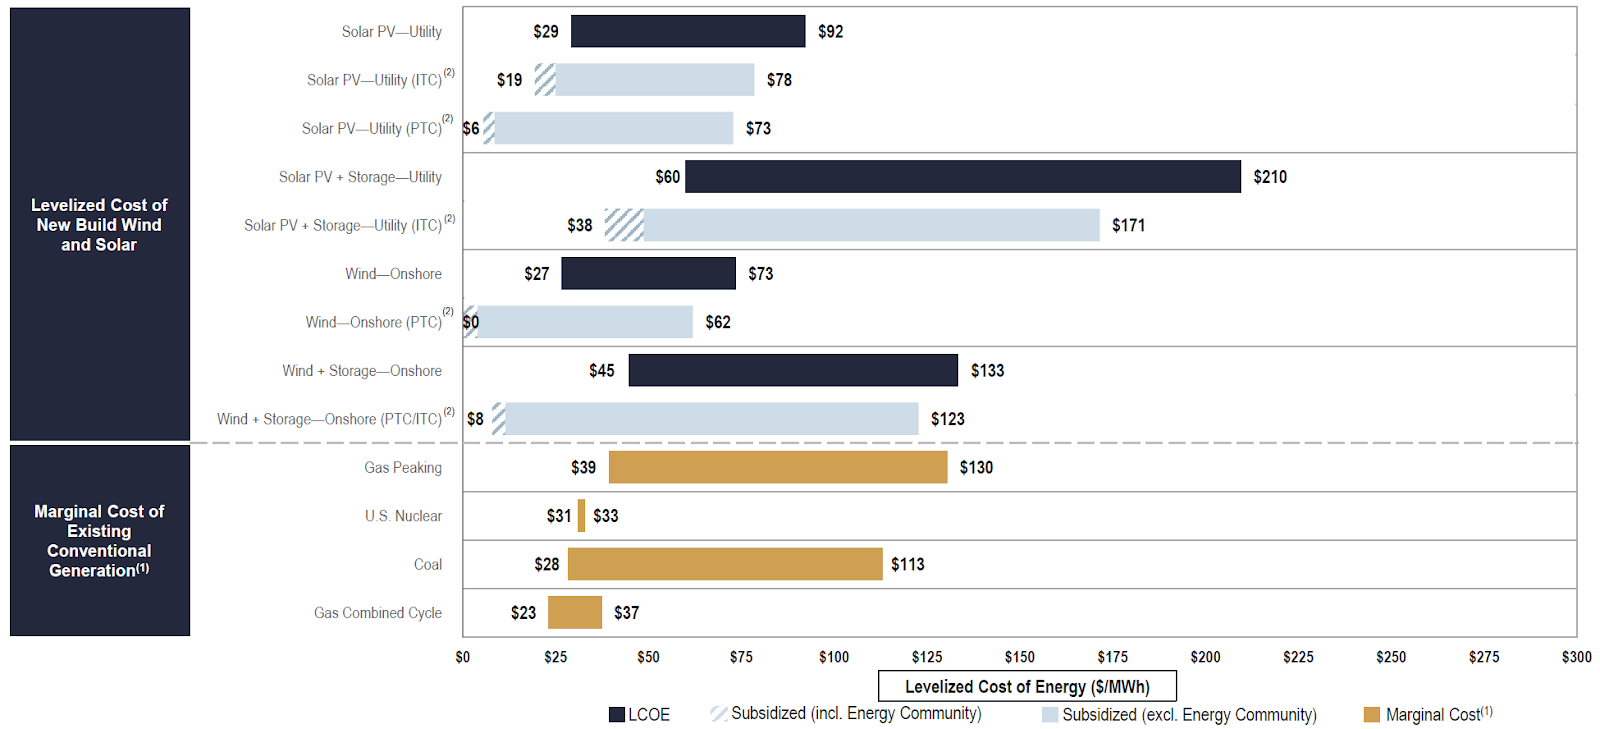
Source: Lazard1. Solar PV at utility scale is estimated at between $29-92 per MWh, while the marginal cost of gas combined cycle is estimated at $23-37.
In fact, in 2023 and 2024, the biggest driver of new power generation in the US was solar, accounting for 54% of new generation in 20232, and 58% in 20243. If you include battery storage, the 2024 figure is 81% of new generation and storage. Solar has had an incredible run since around 2008, with the cost to generate a watt of power from solar panels coming down around 93% since that year4. Also of note is the dramatic cost reductions in battery storage. The drop in battery prices along with solar PV is an enabler of the historical and future solar expansion5. An example of a project to come online this year is Gemini - the largest co-located solar plus battery energy storage system (BESS) in the US. Many such projects are reaching maturity across the US (IEA)6.
The fact that solar accounted for over half of the new generation in the US the past couple of years surprised me, and got me questioning whether I’m missing a large market shift, or whether estimates of true solar costs are misstated. What assumption might be wrong in our assessment of relative power costs? Surely the massive abundance of natural gas in the United States means that it’s the cheapest both on an all-in and marginal basis? Maybe solar panels don’t last as long as the forecasts say, they are being sold more cheaply to the US market than cost of production, or there are hidden costs that make solar more expensive than estimates (i.e. transmission or battery storage). I’m going to explore the solar industry and figure out what has happened over the last 15-17 years to enable the dramatic reduction in costs and what will happen in the future.
Some questions that need to be answered to take a view on the next decade or two of solar:
What happened to facilitate the dramatic cost reduction in the past two decades? What will happen next?
Are there any issues with the levelized cost of energy analysis? What assumptions need to be questioned?
What impact does intermittency have on how we view the costs of solar? What about sunlight availability?
How does the cost of storage via Battery Energy Storage Systems (BESS) impact the all-in cost?
Does the fact that China dominates supply chains impact the way we see solar prices moving forward?
Note that the vast majority of solar manufacturing is in China, accounting for around 80% of the global supply of solar modules in 2021, and almost all the wafer production worldwide:
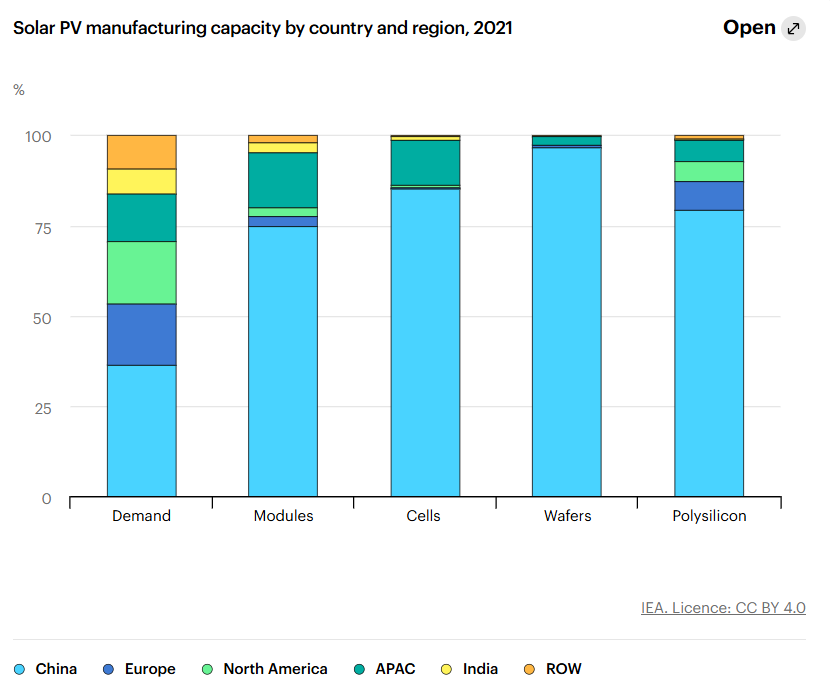
Source: IEA7
This means that this is not just a cost question but also a question of trade and protectionism that impact the real costs that consumers see. The carrot and stick of American trade and manufacturing policy (Biden tariffs in November 2024, Inflation Reduction Act subsidies, “Liberation Day” tariffs8) will likely have an impact on the international prices for solar capacity. But my interest is whether, independent of trade barriers or subsidies, solar will continue to compete on a cost basis with other sources of generation.
I’m going to start with the technical details of cost reduction for solar cells. This requires me to go through the manufacturing process and examine - what has physically changed over the last 15 years that has resulted in lower costs? Let’s explore.
Cost Reduction
Solar cells have a specialized and highly technical manufacturing process. The following diagram illustrates the process for silicon based solar modules:
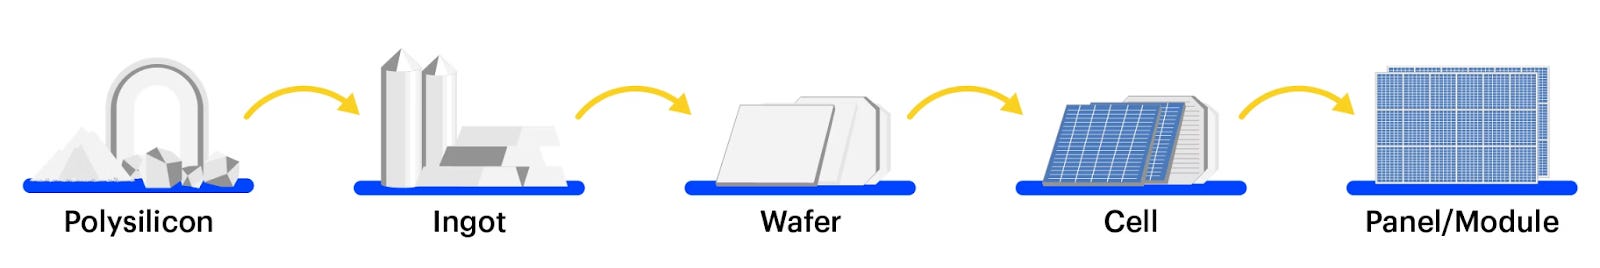
Source: IEA9
First, polysilicon is created from its feedstock (mainly [>80%] using a high temperature process called the Siemens process). Next, single crystals are generated using a crystal seeding process called the Czochralski method. These are then cut into wafers and doped to give them the electrical properties of solar cells. Panels are then constructed, an array of cells sealed and wired together.
Since 1976, solar panels have been on a “learning curve” of cost reduction of 20.2%, compounded each time capacity is doubled. This means every time we’ve doubled the cumulative installed capacity, solar panels have gotten ~20.2% cheaper. Because of the magic of compounding, this means that between 1976 and 2019, solar cells have gotten 99.6% cheaper:
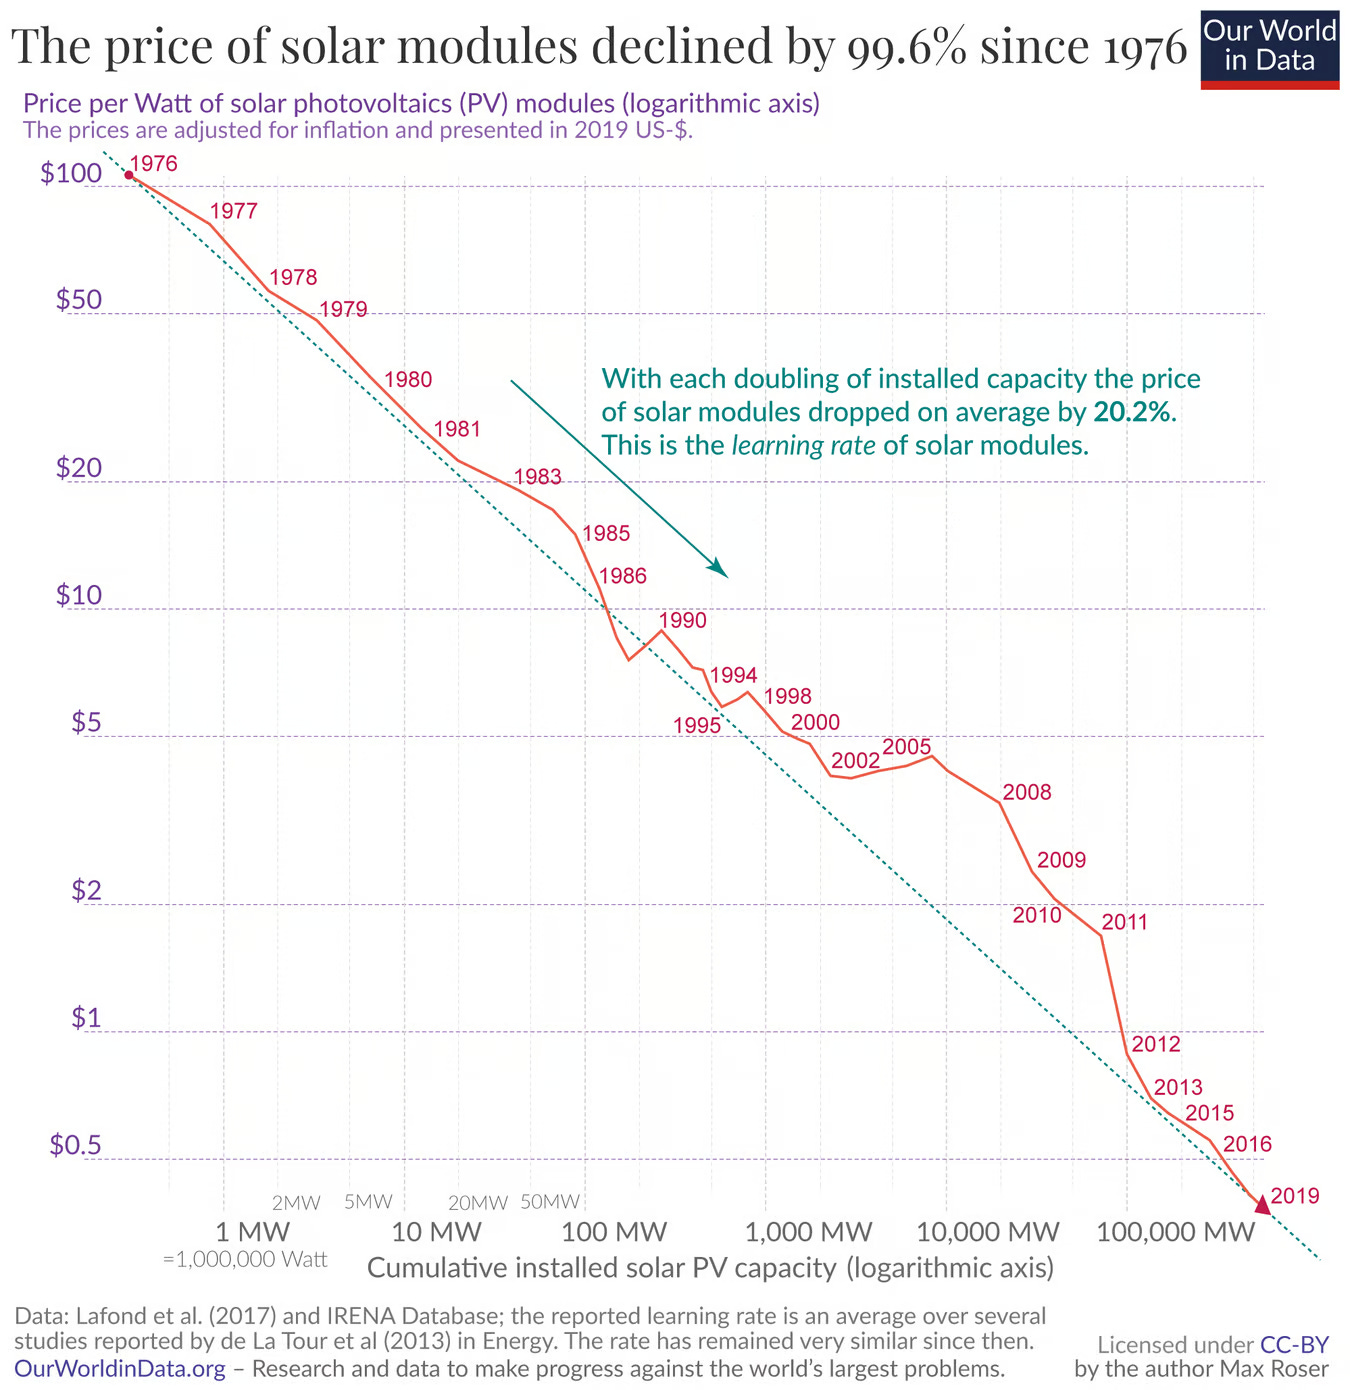
Source: Our World in Data10
This follows a pattern called “Wright’s Law”, where the doubling of capacity drops manufacturing capacity by some fixed quantity11. This phenomenon doesn’t assign mechanisms to the reduction in costs, it’s empirical. So what actually caused the cost reduction? The National Renewable Energy Laboratory has some more detailed break-outs of the cost reductions:
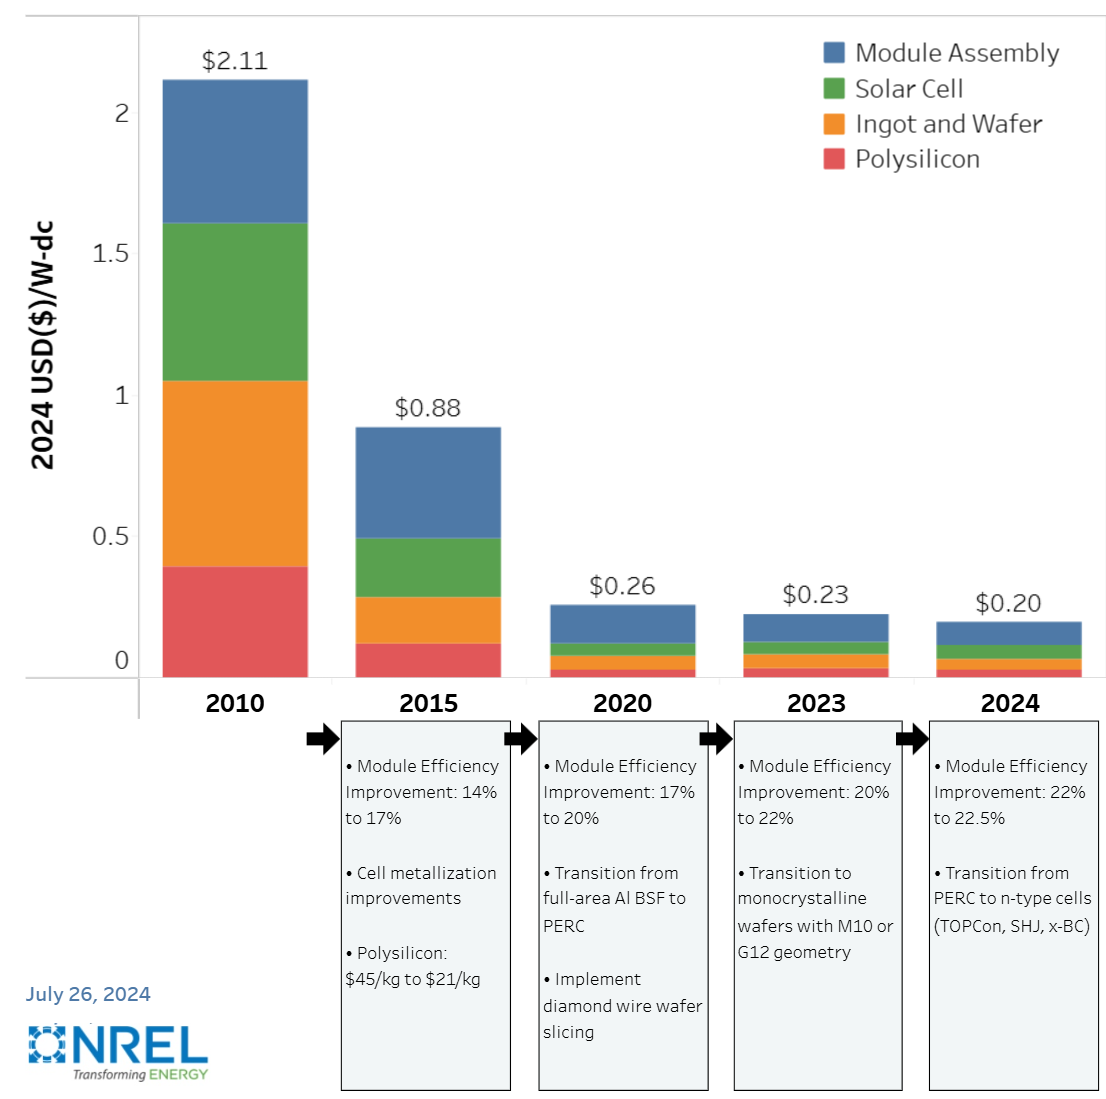
Source: NREL12
You can see that each of the four categories (polysilicon, ingot and wafer manufacture, solar cell manufacture, module assembly) cost a fraction of what they did in 2010. Raw material costs have come down, partially due to the fact polysilicon production is up 8x from 201013. Ingot and wafer production costs have come down significantly, due to improved manufacturing processes and economies of scale (for example the “wire cutting” methods to make wafers today lose less raw material and operate 75% quicker than old cutting methods14). There have been some technological and material science improvements (i.e. module efficiency), and then the cost of module assembly has also come down. Most of the reduction in unit costs are manufacturing economies of scale all the way up the supply chain from polysilicon production to the module assembly.
Where are costs headed?
In my estimation, there are three ways that costs can continue to come down in the next two decades:
Drop in raw materials costs (polysilicon, aluminum, etc.)
Manufacturing and process improvements
Increases in cell performance (more power generated per unit cost)
Let’s look at each one individually.
Materials
Polysilicon is the precursor to the crystalline silicon used in the solar cell manufacturing process, and probably will continue to be, as silicon solar cells will most likely continue to dominate. Polysilicon accounts for ~35-45% of the material cost of a solar module15. The polysilicon price has been relatively low for the last ~15 years, after spiking between 2004 and 2009:
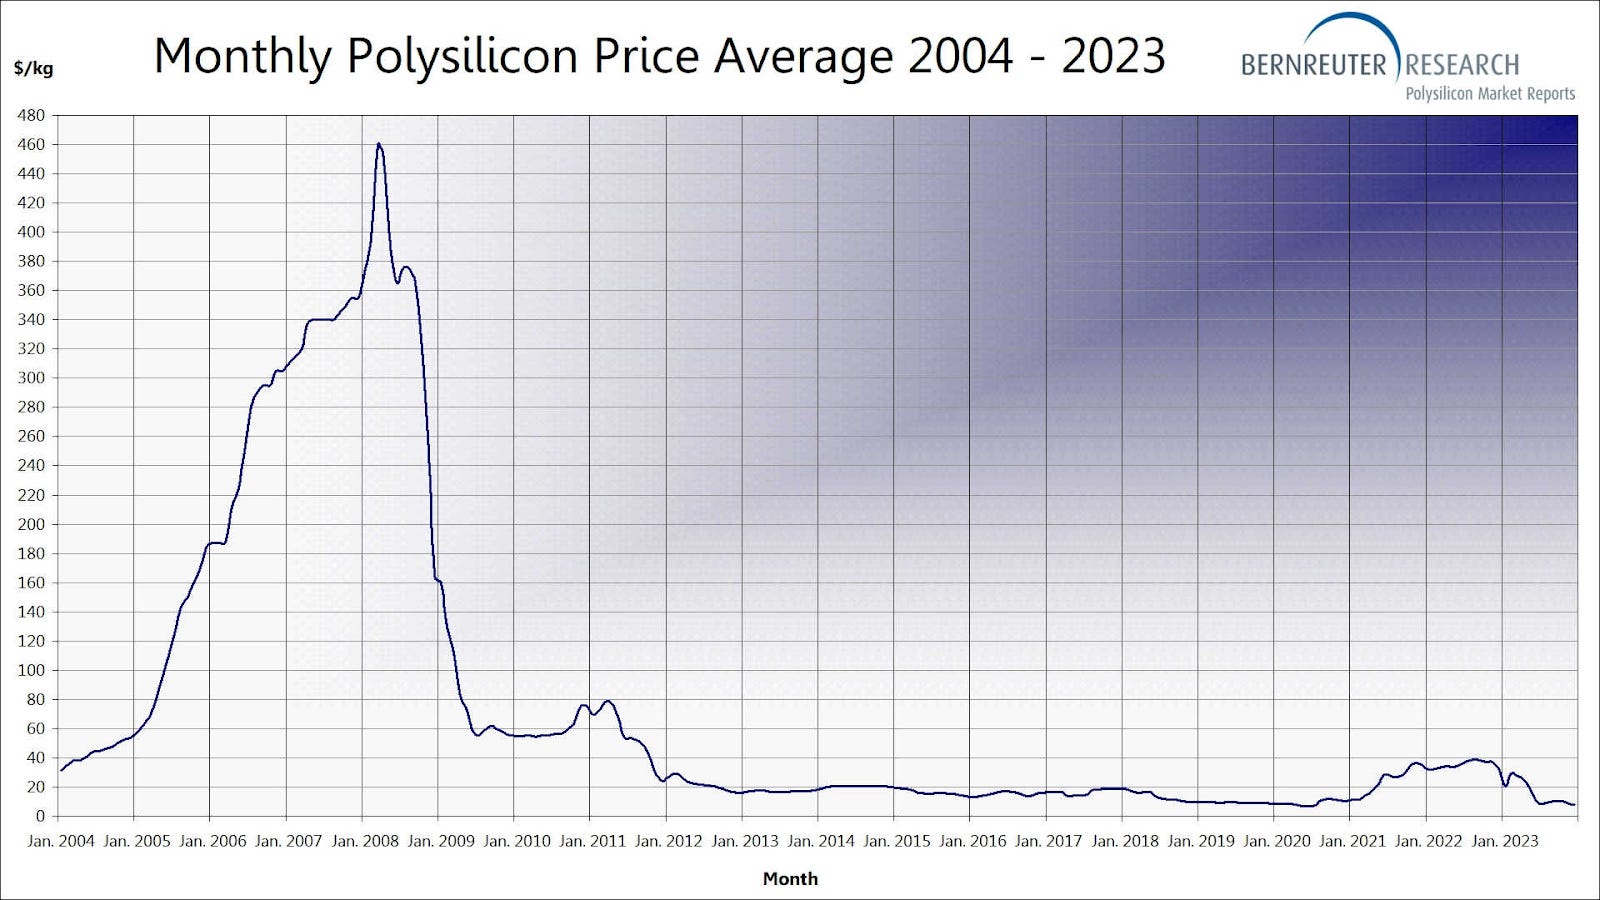
Source: Bernreuter Research16
If you look at the learning curve chart, you’ll see that the trend of cost reduction slowed during this period, a direct impact of the increased polysilicon prices.
As we saw before, most of the polysilicon production is in China or APAC, with some in Europe and America. To predict where costs are headed, we would probably benefit from seeing industry cost curves. But in lieu of having that data, let’s work out the cost of supply for a large polysilicon producer, Wacker. Wacker was the number 3 worldwide polysilicon producer in 202017. If I take their (revenue - EBIT)/production for the polysilicon division, I should in theory get the cost of supply including capex. When I do this for 2021, I get about $14.76 per kilo. Here is what the chart for Wacker has looked like for the decade prior to 2021, with the independent variable of throughput:

Source: Wacker IR18
You can see that economies of scale have brought unit costs down over this decade, but that decreases in polysilicon are asymptoting and probably won’t go much lower than these unit costs of around $15/kg, unless there’s a step shift in the process. China can probably go much lower than the figure above, as evidenced by the disparity between the non-China and Chinese spot prices:
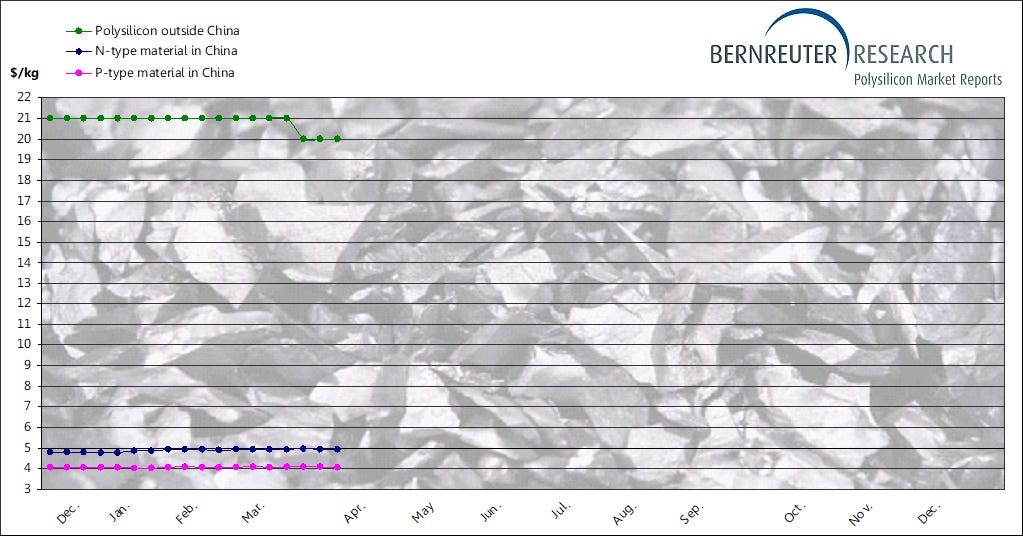
Source: Bernreuter19
Chinese spot prices this year are a third of Wacker’s cost of supply! Outside of reducing any trade barriers between China and the rest of the world, it seems like incremental gains in efficiency due to economies of scale will be hard to come by. Wacker has bottomed out in unit costs with scale, so it would make sense that Chinese companies with similar scales would have bottomed out as well. I am not sure there will be much to gain in the polysilicon prices, besides marginal improvements or increased scale, which can bring down unit costs by some marginal amount.
There are other materials involved in the production of solar modules:
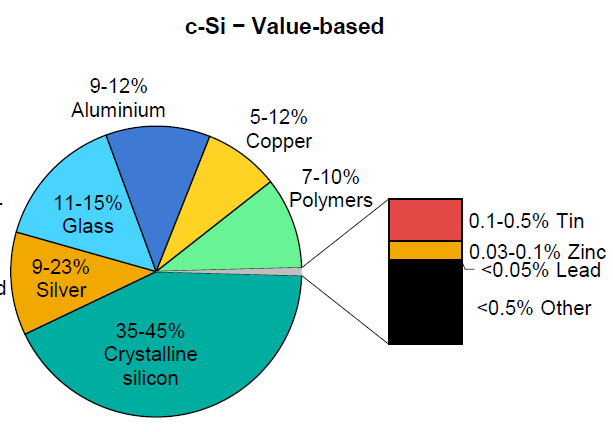
Source: IEA20
The rest of the materials on this list all seem to be flat to up over the past two decades, and their markets are highly dependent on other industries. Silver ($11.37/o - $29.59/o), glass (index=100.7 - 174.5), aluminum ($1836/T - $2571/T), and copper ($1.50/lb - ~$4.50/lb) are all up significantly over the last 20 years21. Along with polysilicon, these make up the bulk of the material costs of solar modules.
The other potential gain from materials is the amount of each material used. For example, the International Technology Roadmap for Photovoltaics (ITRPV) predicts that the amount of silver used in solar modules will go down by 40% in the next decade for the dominant solar cell architecture22. But solar cells account for 18% of the world’s silver demand, and new solar cell architectures use even more silver than prior designs. So there’s pressure both ways. Also, silver being so decoupled from the solar market, it seems unlikely that reduction in silver usage will offset the impact of silver price inflation. Most of the other materials are in the same boat, with market prices moving independent of solar, and increasing prices over the last couple of decades.
So it doesn’t seem like the majority of cost reduction will come from the raw materials that go into making solar cells.
Manufacturing and Process
The process of creating monosilicon, cutting into wafers, doping, then creating modules, has become faster and less wasteful over the last 15 years, resulting in a much higher watt per gram of polysilicon. Improvements include the following23:
Larger ingots and wafers (more surface area)
Diamond wire cutting (faster, better quality cuts, and less wasteful)
Move to monocrystalline silicon (higher efficiency)
Expansion of production capacity (economies of scale)
It is plausible that manufacturing will continue to get become more efficient and streamlined over the next two decades as manufacturing capacity expands. But it probably depends on the scale of investment in both scaling up manufacturing and research and development over the next couple of decades.
There might even be new manufacturing processes that dramatically reduce the cost of solar cells. For example, the German company Nexwafe wants to scale up a manufacturing process based on chemical-vapor-deposition rather than the traditional Czochralski (CZ) method24. In the CZ process, a single crystal is generated from molten silicon and then cut into wafers. The silicon needs to be heated to 1300+ degrees celsius to create monocrystals, involving a massive amount of heat energy (a process that might only be 6.5% efficient25). Nexwafe claims that their process can reduce the cost of silicon wafers by 30%26. This is done by lowering the energy intensity and reducing waste from the manufacturing process (which can be up to 45% of the silicon ingot produced by CZ27).
Additionally, wafer sizes are predicted to keep growing slightly, kerf losses (losses during the cutting process) are predicted to go down through improved cutting processes that could reduce waste by 25%, recycling rates are expected to rise, and throughput is expected to increase2829. In the next decade, it’s expected that the amount of polysilicon used per watt of generation will decrease another 30%. There is ample room for process improvements as we keep focusing time, research, and investment on solar manufacturing techniques.
Increases in Cell Performance
Efficiency is defined as the percentage of solar irradiance that can be converted into useful electrical power in a solar cell. The first silicon solar cell was manufactured at Bell Labs in the 1950’s, and was 6% efficient30. Today, industrial scale cells are ~22-23% efficient. Every unit of efficiency gained reduces the cost per unit of power. The science of solar cells is important to explain here, because the limits of what we are able to achieve is a science problem as much as it is a manufacturing problem.
The dominant solar cell type is silicon monocrystal, which has dominated worldwide shipments of solar tech since 2020:
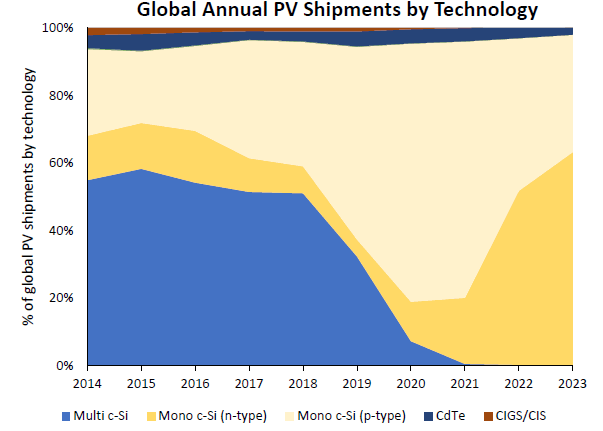
Source: NREL 2024 Solar Industry Update31
Silicon doped with either phosphorus (n type) or boron (p type) is the basis for the vast majority of solar cells, with n-type rising in recent years (more on the technical details of how this works in a future paper). With silicon as our choice of semiconductor, we are limited in what we can possibly expect for efficiency. This is because any single material will be limited in its ability to absorb the spectrum of irradiance from the sun. In fact, there is a theoretical limit for a single material of 33.7%, known as the Shockley-Queisser limit32. This means that for any material, the maximum efficiency we can ever expect to achieve is 33.7%. For silicon, this number is even lower, around 29.4%.
So, as long as silicon is our semiconductor of choice, we will never achieve efficiencies of over 29.4%. So why are we so far away from 29.4% currently?
Well, in reality, the best research has gotten close. Here is a chart of the best cell efficiencies over the past 50 years, with crystalline silicon in blue:
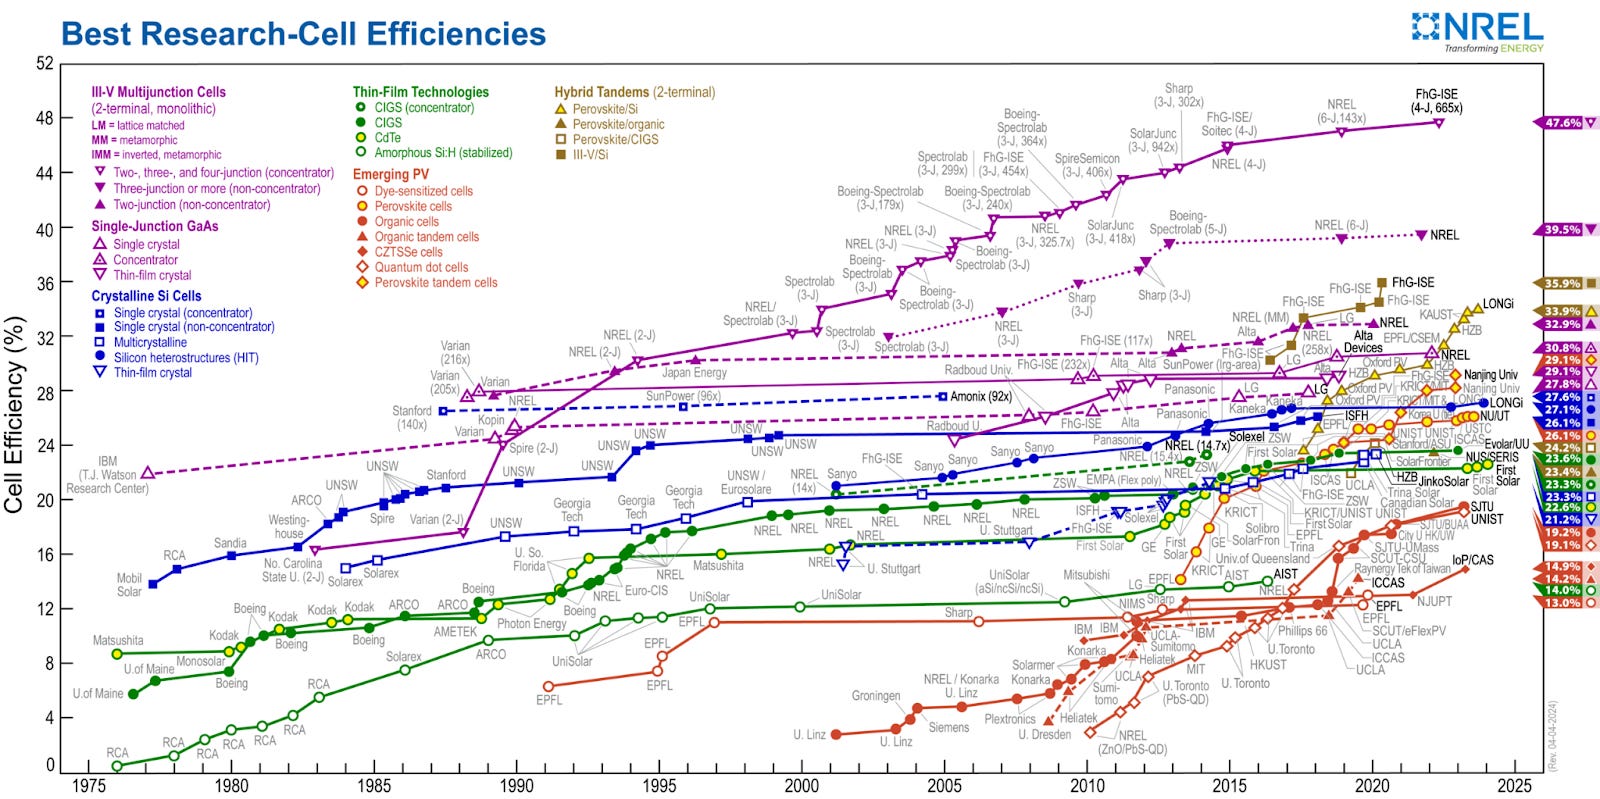
Source: NREL33
You’ll notice two things: 1) researchers have achieved 27.6% efficiency for crystalline silicon in lab environments (in fact LONGi just announced another record of 27.81%34), and 2) crystalline silicon isn’t even near the top of the efficiency chart. In fact, another cell architecture (created by the Fraunhofer group in Germany) was 47.6% efficient!
Efficiency degradation - there’s a few things that reduce the efficiency of cells from the theoretical maximum - namely light reflectance, metal contacts, temperature effects (1°C causes ~0.45% efficiency loss35), and electrons that are lost to “recombination” (they get “stuck” and never flow through the circuit36). Installed PV also has real-world impacts of dust, shade, and orientation. In addition, cell efficiency degrades through time, around 0.5-0.7% per year37. This is why module efficiency and installed efficiency is lower than the theoretical limits.
There is continued research and development into reducing these losses in efficiency, and new silicon module designs are being implemented and developed at scale. For example, PERC was the dominant cell type in 2022 (75%+), but in 2024 TOPCon is predicted to have 50-75% market share. TOPCon is designed to improve the efficiency of modules by reducing the number of electrons that are wasted to recombination, increasing overall efficiency by 1-2%, with better performance at higher temperatures and reduced degradation through time38. These wild changes in dominance over such a short time frame indicate there is more to go in the search for the best silicon module architecture.
High efficiency cells - the highest efficiency cells in NREL’s chart is a multijunction cell. This means multiple materials are used to sample more of the light spectrum. These multijunction cells can achieve much higher efficiencies than crystalline silicon cells. Most of these technologies won’t compete with silicon commercially because silicon is so abundant (28% of the earth’s crust by mass), and manufacturing multijunction cells is complicated, making it more expensive per watt39. There is more promise in improving the efficiency of silicon cells (and potentially adding some incremental gains to silicon cells).
Bottom line, even if materials might not move the needle, between manufacturing and efficiency, there are so many ways to win that it seems likely that silicon cells will continue to get cheaper, as long as we continue to invest in research and development. We currently lose ~45% of monosilicon just to the cutting process, we haven’t locked down on wafer sizes, and there’s plenty of ways to make cells more efficient even while staying with silicon technology. This is probably what the learning curve says, that the opposite of “death by 1000 cuts” is possible when we focus on a process. We find and exploit the many ways to win and continue to make incremental gains if we continue to invest at scale.
That’s all I’m going to cover today, but there are other major issues to address and explore with solar - intermittency and storage, LCOE assumptions, and reliance on China for most of the solar supply chain (especially in the context of international trade and tariffs).
My conclusion on the cost and efficiency of solar cells is that cost per watt should continue to decline over the next two decades, ceteris paribus. Export controls and tariffs will affect revenue and investment, reducing the capital that goes into the manufacturing process, and that’s a topic for another day.
https://www.lazard.com/media/xemfey0k/lazards-lcoeplus-june-2024-_vf.pdf
https://www.eia.gov/todayinenergy/detail.php?id=55419
https://www.eia.gov/todayinenergy/detail.php?id=64126
https://ourworldindata.org/grapher/solar-pv-prices#sources-and-processing
https://about.bnef.com/blog/lithium-ion-battery-pack-prices-hit-record-low-of-139-kwh/
https://www.primergysolar.com/posts/historic-gemini-solar-energy-storage-project-reaches-commercial-operations-in-nevada
https://www.iea.org/reports/solar-pv-global-supply-chains/executive-summary
https://www.pv-magazine.com/2025/04/16/solar-cells-not-exempt-from-us-tariffs-despite-media-reports/
https://www.iea.org/reports/solar-pv-global-supply-chains/executive-summary
https://ourworldindata.org/cheap-renewables-growth
https://en.wikipedia.org/wiki/Experience_curve_effects
https://www.nrel.gov/solar/market-research-analysis/solar-manufacturing-cost.html
https://thundersaidenergy.com/downloads/global-polysilicon-production-capacity/
https://www.azom.com/article.aspx?ArticleID=16422
https://iea.blob.core.windows.net/assets/d2ee601d-6b1a-4cd2-a0e8-db02dc64332c/SpecialReportonSolarPVGlobalSupplyChains.pdf
https://www.bernreuter.com/polysilicon/price-trend/
https://www.bernreuter.com/polysilicon/manufacturers/
https://www.wacker.com/cms/en-us/investor-relations/financial-reports/financial-reports-overview.html
https://www.bernreuter.com/polysilicon/price-trend/#current-polysilicon-spot-price
Same as 15
https://www.macrotrends.net/1470/historical-silver-prices-100-year-chart, https://fred.stlouisfed.org/series/PCU3272132721, https://fred.stlouisfed.org/series/PALUMUSDM, https://www.macrotrends.net/1476/copper-prices-historical-chart-data
https://www.qualenergia.it/wp-content/uploads/2024/06/ITRPV-15th-Edition-2024-2.pdf
Same as 22
https://cleantechnica.com/2023/06/02/how-low-how-green-can-solar-cells-go-the-magic-word-is-kerfless/
https://www.researchgate.net/publication/389791378_Heating_efficiency_and_energy_saving_potential_of_Czochralski_crystal_growth_furnaces
https://www.nexwafe.com/news/nexwafe-secures-30m-to-break-ground-on-first-commercial-scale-green-solar-wafer-plant
https://www.nexwafe.com/epinex-wafers
https://pv-manufacturing.org/wafer-sizes/
Same as 22
https://www.smithsonianmag.com/sponsored/brief-history-solar-panels-180972006/
https://www.nrel.gov/docs/fy24osti/90042.pdf
https://en.wikipedia.org/wiki/Shockley%E2%80%93Queisser_limit
https://www2.nrel.gov/pv/cell-efficiency
https://www.longi.com/us/news/longi-world-record-efficiency-of-monocrystalline-silicon-cells/
https://www.solarnplus.com/how-temperature-impacts-solar-cell-efficiency
https://en.wikipedia.org/wiki/Solar-cell_efficiency
https://www.nrel.gov/docs/fy12osti/51664.pdf
https://www.pv-tech.org/cea-on-perc-and-topcon-solar-technology/
https://www.energy.gov/eere/solar/multijunction-iii-v-photovoltaics-research